
Archimedes once said “Give me a lever long enough and a fulcrum on which to place it, and I shall move the world” (or at least someone said that he did so).
I believe that changepoint models are suitable tools to assess energy use in buildings. Once we have a suitable model, then we can do our best to improve the building. Either through improved building controls, HVAC, envelope, or a mix of these.
I wouldn’t compare myself with Archimedes, but it is somehow the same idea.
So, I have devoted part of my activity throughout the last couple of years to better understand changepoint models. And how they can be applied to a number of situations.
Since I joined Deusto, I have had the chance to work with many students. Marie Parant is one of these. She came over the second semester, to work with us. Somehow, I convinced her to work with changepoint models. Her work over a recent dataset from LBNL resulted in a number of interesting ideas.
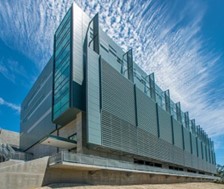
LBNL building 59 is located close to San Francisco, and was monitored by some some smart guys that delivered the data openly to the world!
From previous works over residential buildings, we have already identified the need to consider social factors as part of the models. This results in various daily energy load profiles, and/or different changepoint parameters for each hour of the day/week.
This building was far mor complex, with many internal zones being served through various distribution systems in a lighter than average building, varying occupancy patterns and concurrent heating and cooling systems. Not to speak about COVID, and some local events such as wildfires. Altogether the energy signatures were quite messy.
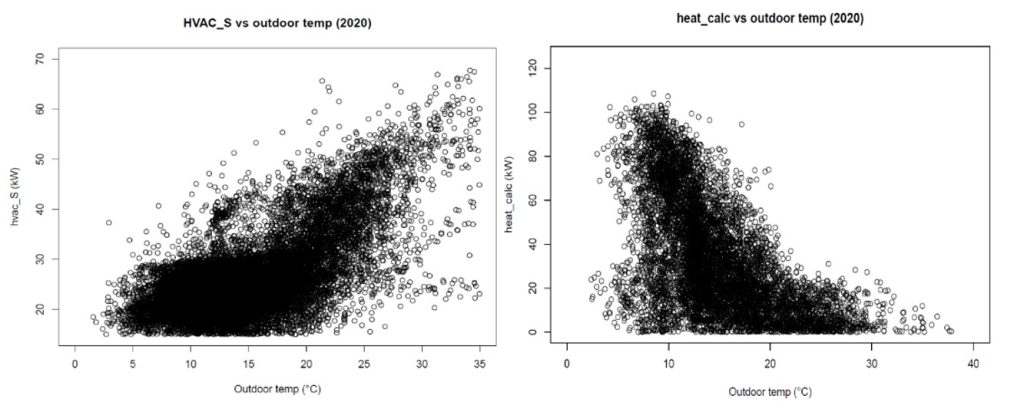
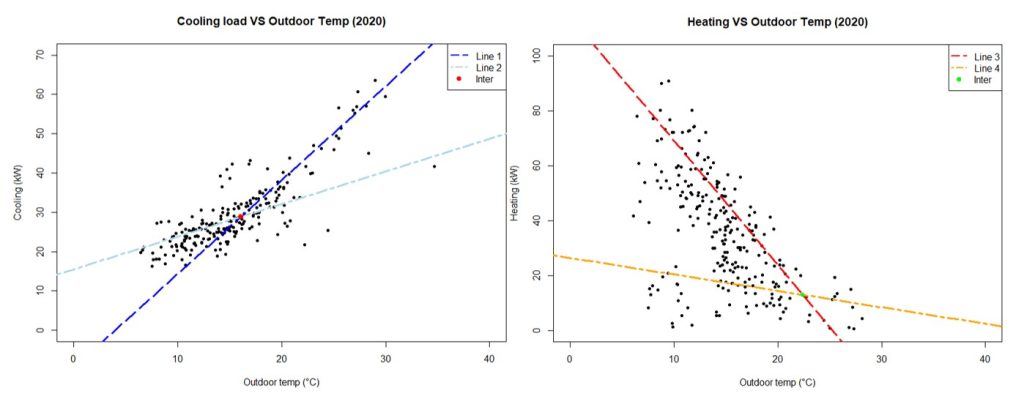
We finally decided to develop two individual changepoint models. One for heating and another one for cooling.
The outcome was not bad. There were however some days with loads highly deviated from the model. We tried to look at why/when this was happening. These discrepancies were expected to meet the already known abnormal behavior due to holidays, COVID, and some other events.
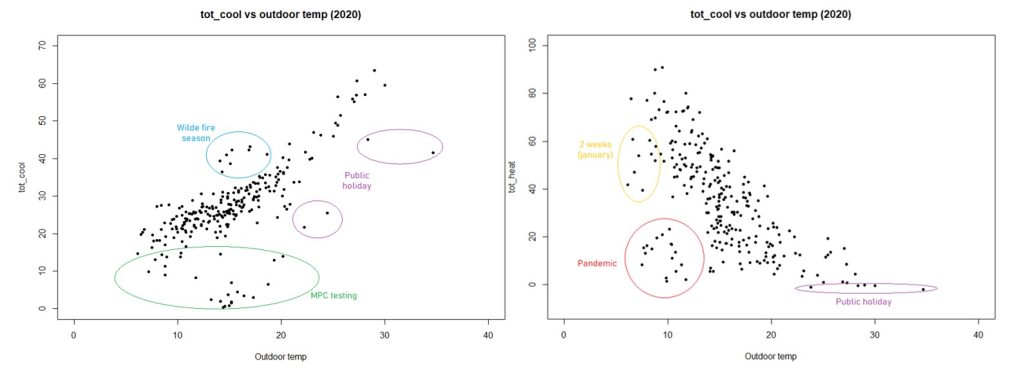
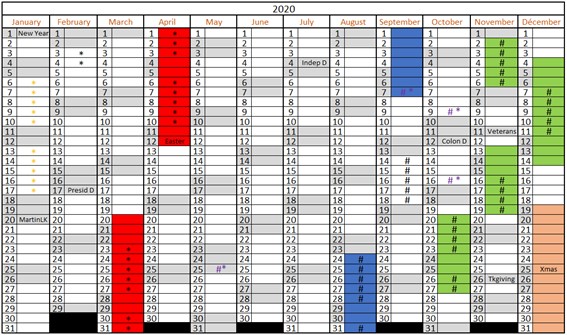
The surprise came when other days with abnormal behavior were also identified. Of course, we all know about false positives (when you detect something, just because you are looking for it. Whether or not it is actually there), but many of these days with abnormal behaviors are actually grouped in three specific weeks in January and September (see *s and #s in the calendar). So maybe they are actual deviations not properly accounted for in the documentation of the building.
But not everything was about (blind) changepoint models. We consume energy because we want to be comfortable inside. Changepoint models can model these loads, but do not deliver information on comfort levels. So, I asked Marie to answer two questions:
- Are temperature levels uniformly distributed in the building?
- Is some area significantly out of comfort?
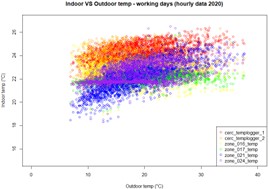
In any building, the answer to the first question is always NO. Also here, with temperature differences in the range of 2-3 ºC. If each zone is within comfort ranges, this is not a great deal. Basically, it is due to varied internal gains and exposure to the outside, and it is dealt with zoned HVAC systems.
Some zones were also found to be out of comfort ranges (see zone 021). Here, the HVAC system was not able to keep temperature levels above 20ºC when outdoor temperatures were lower than ~15ºC. This is something relevant to know for facility managers, potentially requiring relevant amounts of money to improve the HVAC system.
It should be noted as well that the changepoint temperatures identified suggest that the building is quite inefficient. This was also identified by the authors of the original work when they benchmarked the energy consumption of the building against similar buildings in the country.
Overall, it was very nice to have Marie with us in the second semester. She worked nicely and the outcomes were very interesting.
Shall someone want to go the same path, the dataset is documented and fully available in the following paper:
Luo, N., Wang, Z., Blum, D. et al. A three-year dataset supporting research on building energy management and occupancy analytics. Sci Data 9, 156 (2022). https://doi.org/10.1038/s41597-022-01257-x