When dealing with data, we need to know if this data is reliable to build models, or not. This is a tricky issue, as data is typically gathered automatically with very little supervision. Data quality needs to be defined a posteriori, with little-to-no registers on system anomalies. So, how can we actually do this?
Some typical solution for this is to define the distribution of a certain signal and remove those observations that are too far from their reasonable distribution. With a typical distribution, those that separate more than 2 standard deviations from the mean value are removed (this is typically called the 95% confidence interval).
But this approach is not valid for many building energy-related datasets. If we remind some basics in statistics, we can see that this approach is only valid for normally distributed datasets. And this is not the case in buildings. Load is clearly dependent on outdoor temperature, season (correlated to temperature), and usage patterns.

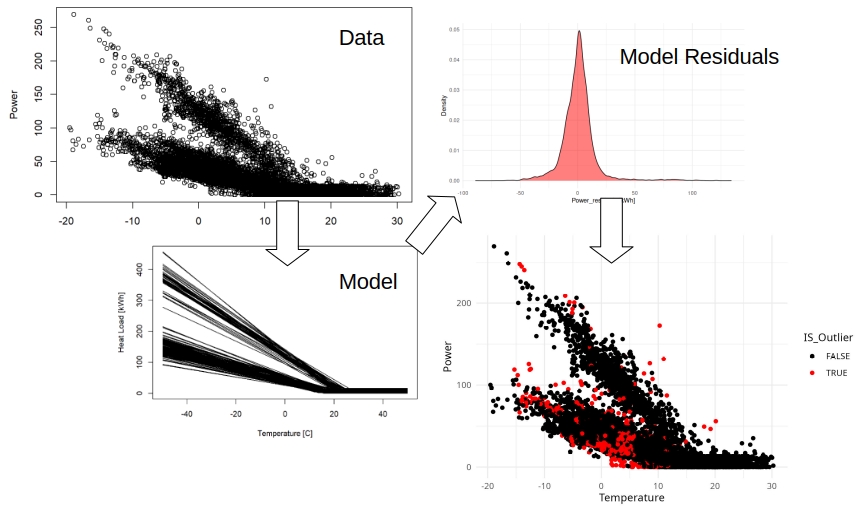
So what can we do here? We have performed research works on changepoint models, that seem to be suitable to predict the energy performance of buildings. In theory, once the models are calibrated, the errors should be somehow close to being normally distributed. So I built a concept to identify outliers, based on the residual of changepoint models. As you can see below, it now seems closer to a normal distribution.
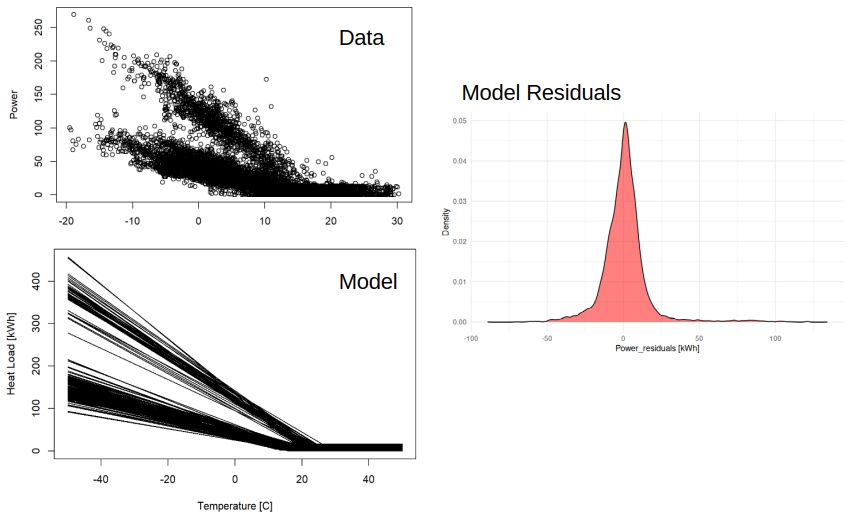
We know that changepoint models are far from perfect in modeling the short-term dynamics of buildings (I just posted about alternative models). But these can be used to consider the main climate and usage patterns in buildings, so that we avoid comparing observations from cold January and hot August directly. In the new approach, I compare the deviations of those observations from the model.
Adding a soft constraint (potentially much larger than 2 standard deviations), we identify outliers, while leaving room to avoid model inaccuracy resulting in false outlier detection.
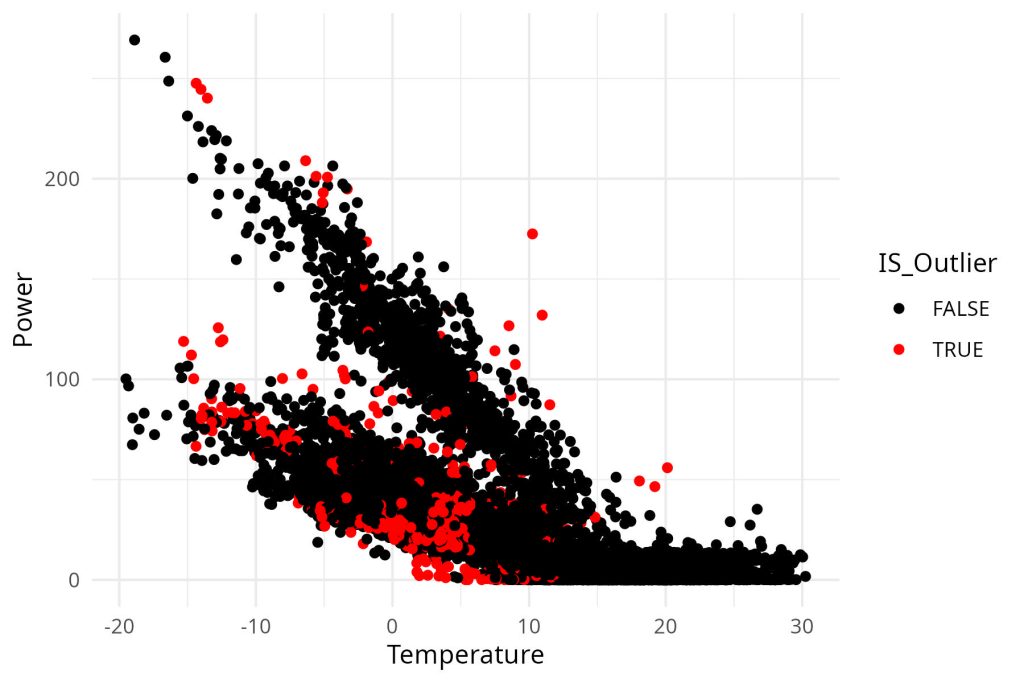
This is somehow a physics-informed outlier detection process. A quite basic one, that can be used directly over heat/electric meter data.
I know that there are several researchers working on identifying sensor misreading based on inconsistent readings from groups of signals. This is also a very interesting approach, but this approach works directly with uni-variate load signals (with meteorological data).
Last year, together with Talha Siddique and Juan Manuel Lopez, we converted this outlier detection process into a paper and sent-this out to a conference. You can have a full read here: Roberto Garay-Martinez, Muhammad Talha Siddique, Juan Manuel Lopez-Garde, Model-based Outlier Detection in District Heating Systems, Procedia Computer Science, 246, 2024, https://doi.org/10.1016/j.procs.2024.09.646
Actually, I published the code for all this some time ago. You can find it here: Roberto Garay-Martinez, Heat Load Characterisation, 2023, https://github.com/robgaray/Building_Heat_Load_Characterisation, https://doi.org/10.5281/zenodo.7692351